
Hone Your ECG-Interpreting Skills with the Clinical ECG Qbank

Related Articles


Do you wish you could read ECGs like a cardiologist? Do you want to know more than just millimeter cutoffs when it comes to the ECG in acute coronary occlusion? While you may have relied on flashcards and textbooks in the past, now there’s an online resource that will change the way you learn to interpret ECGs.
The Rosh Review Clinical ECG Qbank is designed to test your knowledge using real case studies and one-liners of context, allowing you to clue in to diagnoses like you would in a real scenario. This Qbank is designed for medical professionals practicing acute care medicine who regularly rely on ECG interpretation and want to hone their skills (but a beginner’s ECG interpretation Qbank is on the way).
What is the Clinical ECG Qbank?
A bank of questions that teaches and tests the most important concepts of ECG interpretation for life-threatening issues encountered in acute care medicine. Core topics include recognition and diagnosis of dysrhythmias, acute myocardial ischemia and infarction, and hyperkalemia, with many other acute conditions also covered. The Qbank will help you learn how to interpret ECGs with high-yield questions and explanations.
Who should use the Clinical ECG Qbank?
While anyone who is interested in reading ECGs like a pro is welcome to use the Qbank, it’s most applicable for those in cardiology and emergency medicine or those who frequently and quickly need to interpret ECGs in acute care medicine and critical care.
What kinds of questions are included in the Clinical ECG Qbank?
You’ll have access to 500 questions, including 200 single-concept and 300 case-based questions. In a real-life scenario, you won’t just need to know why your interpretation is correct—you’ll also need to know why other options are incorrect. That’s why all 500 Qbank questions include detailed explanations for both correct and incorrect answers (and single-concept questions include a bonus One Step Further question that tests your knowledge of a related topic), so you’ll be confident to make the right call on a moment’s notice.
200 Multiple-Choice Questions
Regular multiple-choice questions test a single concept or single question from a single case. These cases may test something conceptual, such as example 1 below, or may test recognition or differentiation of particular ECG features, such as example 2 below.
Example 1:
Which of the following ECG findings is considered a sign of digitalis toxicity (rather than the digitalis effect at therapeutic concentrations)?
A. Frequent PVCs
B. QT interval effects
C. ST depression
D. T wave inversion
Answer A
Digitalis toxicity can cause many ECG findings, including ectopic rhythms, depression of atrial pacemakers, depression of AV conduction, and triggered automaticity in junctional and ventricular myocardium. Many rhythm abnormalities may result from this, including atrial tachycardia, junctional tachycardia, AV blocks, premature junctional and ventricular contractions, ventricular tachycardia or fibrillation, and bidirectional ventricular tachycardia. PVCs are a manifestation of increased automaticity in the ventricular myocardium.
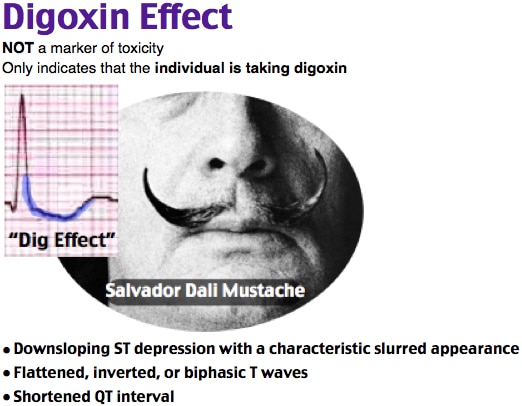
The earliest findings of the digitalis effect (at therapeutic levels) include a sagging or scooped ST segment depression (C) and T wave flattening or inversion (D). Other findings associated with therapeutic levels include QT interval shortening (B), PR interval prolongation, and U waves.
One Step Further question:
True or false: ECG findings of digitalis effect may be present simultaneously with those of digitalis toxicity.
True.
References:
Holstege CP, Kirk MA. Digitalis. In: Chan TC, Brady WJ, Harrigan RA, Ornato JP, Rosen P, eds. ECG in Emergency Medicine and Acute Care. Elsevier; 2005:(Ch) 50.
Example 2:
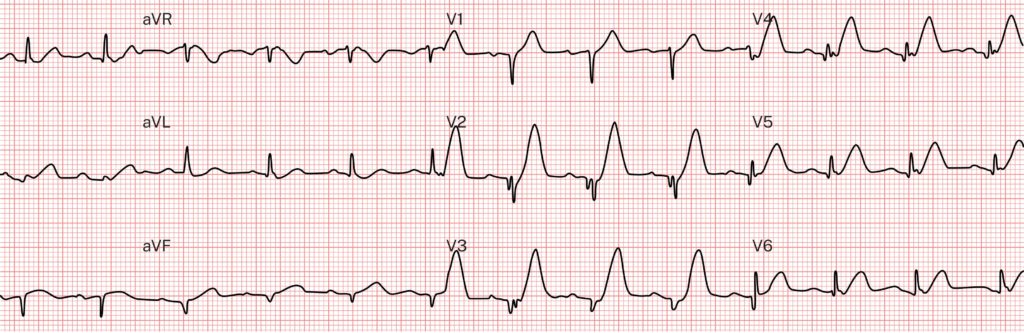
Which of the following best describes the T waves in the ECG above?
A. Hyperacute T waves
B. Hyperkalemic (peaked) T waves
C. Normal T waves (appropriate for the abnormal QRS complex)
D. Spiked helmet sign (increased intracranial pressure)
Answer A
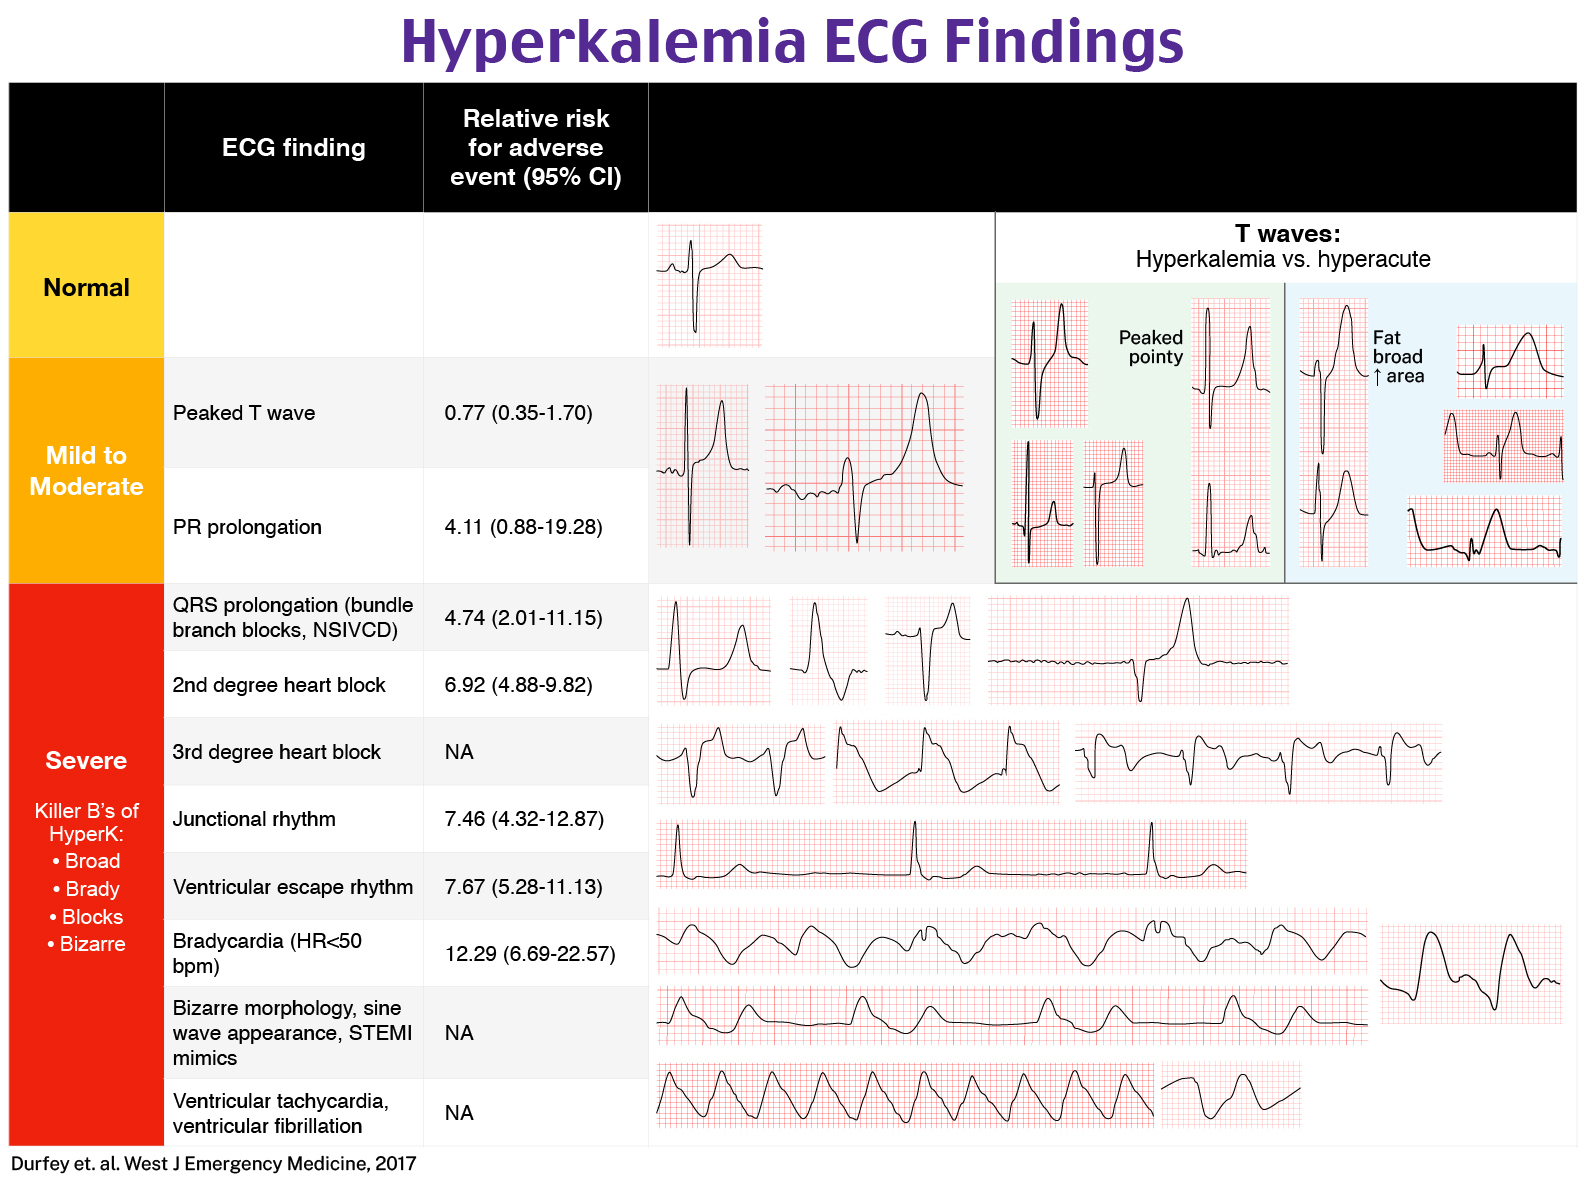
These T waves are massively hyperacute. Hyperacute T waves have no formal definition, but most experts describe them as having increased area under the ST segment and T wave compared to the QRS and compared to the baseline T waves. Visually, it appears as if the T wave is being inflated with air, which accounts for the increased area under the curve and the descriptions such as fat, broad, and tall.
This ECG was recorded in a patient suffering mid-LAD occlusion MI. Hyperacute T waves are one of the first ECG findings within seconds or minutes of acute coronary occlusion, representing acutely ischemic but viable myocardium. Because earlier treatment of occlusion MI maximizes the amount of salvaged myocardium, reperfusion of occlusion MI patients with hyperacute T waves should show greater mortality reduction than those without hyperacute T waves (who are in later stages of infarction, with less viable myocardium to salvage).
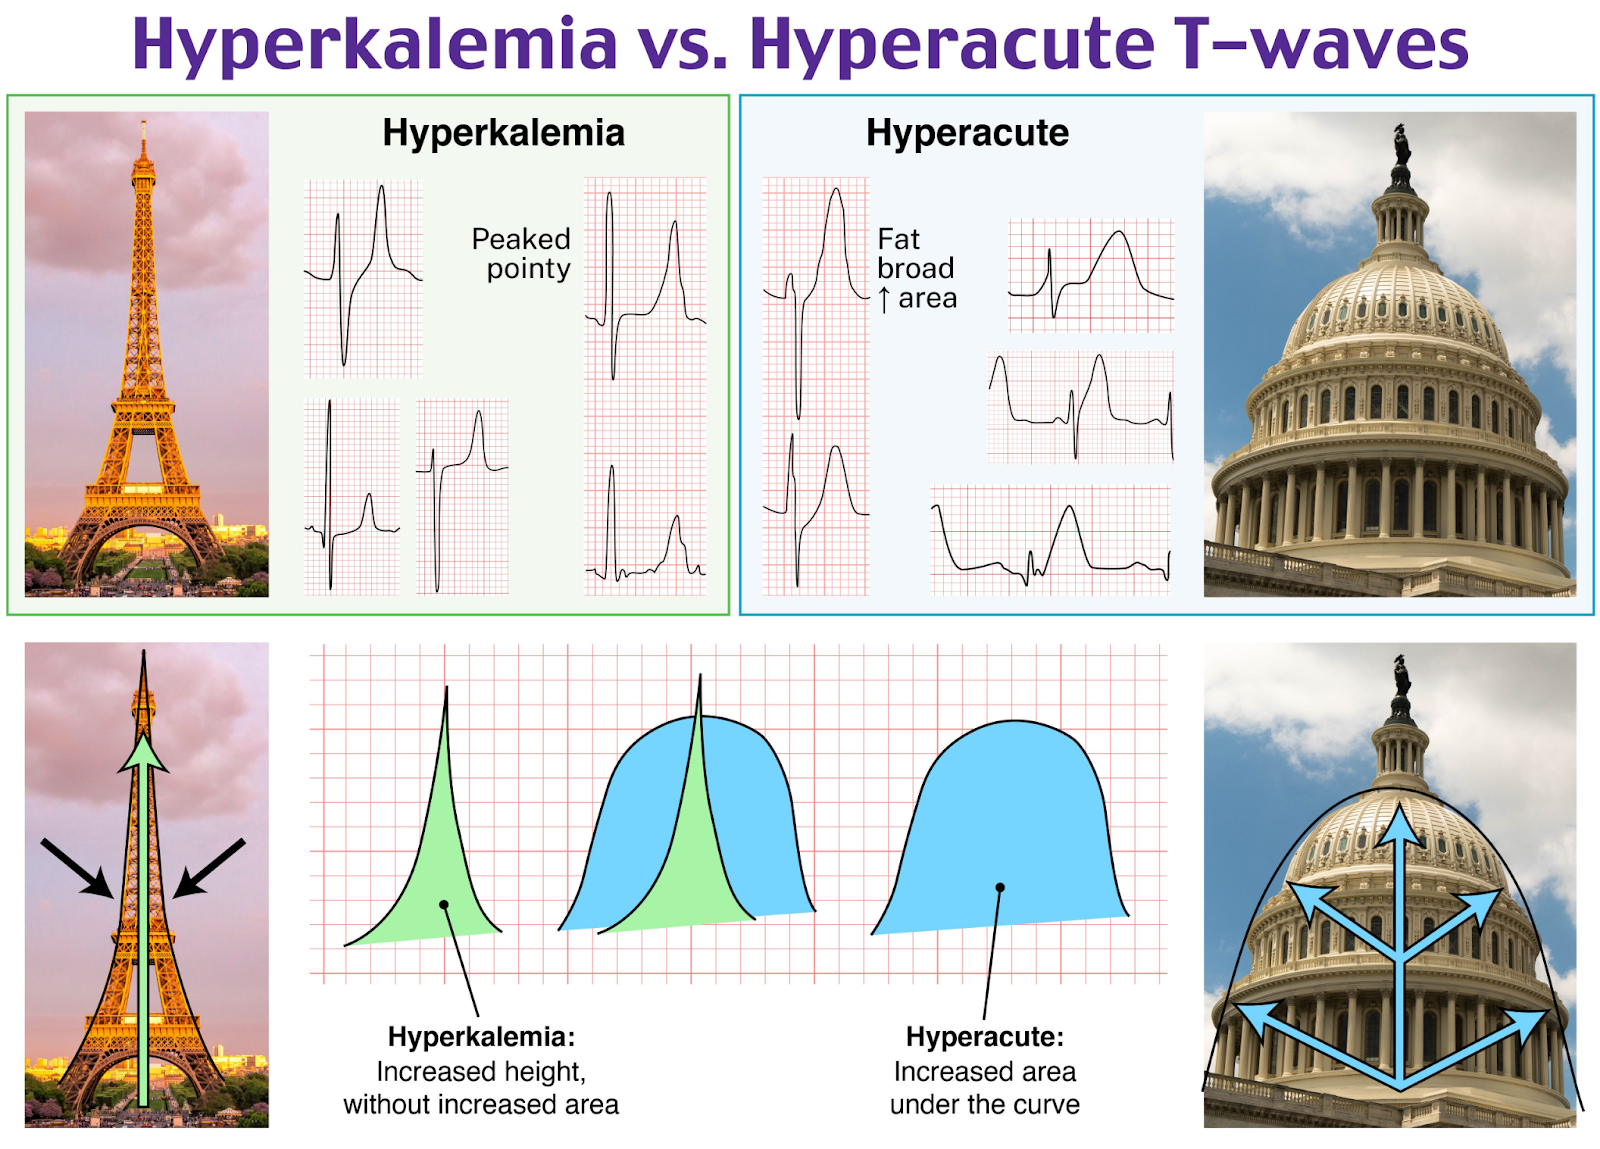
This is in contradistinction to the peaked T waves of hyperkalemia (B), which are also symmetric but are more narrow based, peaked, or pointy and appear as if the T wave apices were being pushed up by a pole when pitching a tent.
Normal T waves (C) must have normal morphology, shape, and proportions compared to the QRS complex that generated them.
Increased intracranial pressure can cause bizarre and diffuse ECG changes similar to takotsubo or stress cardiomyopathy. Spiked helmet sign (D) refers to a bizarre morphology of massively prolonged QT interval such that the entire baseline has a sine wave appearance with superimposed spikes, which are the QRS complexes, overall simulating the appearance of the spiked helmets worn in the late 19th and early 20th centuries.
One Step Further question:
Which lead would be best to look for reciprocal findings if you are suspecting ST elevation or hyperacute T waves in lead aVL?
Lead III is almost perfectly reciprocal to aVL and is highly reliable for showing reciprocal ST depression or T wave inversion when aVL shows ST elevation or hyperacute T waves.
Although single-concept questions are essential for learning, they are not representative of the task we must train for in real life. This Qbank is not designed primarily for passing an exam, but rather for improving ECG interpretation in real-life patient care.
When interpreting the ECG of a patient with an acute medical complaint, we are not simply asked a single multiple-choice question with four possible discrete answer choices. Instead, we must be able to recognize and differentiate many possible life-threatening diagnoses without already having the differential narrowed down to the answer choices presented in the question.
Consider a straightforward multiple-choice question you might see in a regular Qbank, such as a patient history that includes an ECG and asks “What is the most likely diagnosis?” with answer choices of acute pericarditis, myocardial infarction, musculoskeletal chest pain, and Takotsubo cardiomyopathy. These answer choices instantly give you clues about what to look for in the history and ECG. To best learn how to interpret ECGs, you need to know for yourself which conditions to consider and rule in or out based on the information you have prospectively—just like you would in real life.
For these reasons, the Clinical ECG Qbank features questions designed with a case-study format.
300 Case-Study Questions
The case-study questions mimic real-life scenarios: you’re given an ECG and one-liner of context, and it’s up to you to figure out the important parts of the interpretation.
In acute care medicine, we believe these are the 5 most important questions that must be addressed for each and every ECG interpreted:
- What is the cardiac rhythm? Is there a dysrhythmia?
- What is the QRS conduction pattern? How does this affect the interpretation of the other four critical questions on this ECG?
- Is there evidence of acute myocardial ischemia? More specifically, is there evidence of acute coronary occlusion requiring emergent reperfusion therapy?
- Is there evidence of hyperkalemia? Is the patient at risk of acute dysrhythmia or deterioration requiring immediate management of hyperkalemia?
- Is there an acutely life-threatening abnormality of the QT interval? Most commonly, the question is whether or not the patient has a dangerously prolonged QT interval.
Each case-study question focuses on one actual patient encounter, asking these same key 5 questions about that patient’s ECG, for which you have to determine the following:
- Rhythm
- QRS
- Ischemia
- Hyperkalemia
- QT interval
For example, when a real-life patient presents to the ED with weakness, shortness of breath, and bradycardia, you must know to check for each of these important conditions on the ECG, and you must know that (unlike in a multiple-choice question) the patient could have anywhere from zero to all five of these life-threatening problems on the ECG. Does this patient have hyperkalemia causing a widened QRS complex and junctional bradycardia? Or do they have acute right coronary artery occlusion causing AV node ischemia and acute heart block? Are those T waves hyperacute, hyperkalemic, or normal? In order to save lives with ECG interpretation, these five questions must be asked and answered for each ECG you interpret in real life, so we chose to present Qbank questions in the most meaningful and realistic way possible. As in real life, you must decide your answer for all five questions before you find out whether you are ultimately correct.
Here’s an example of a case-based question series:
Baseline:
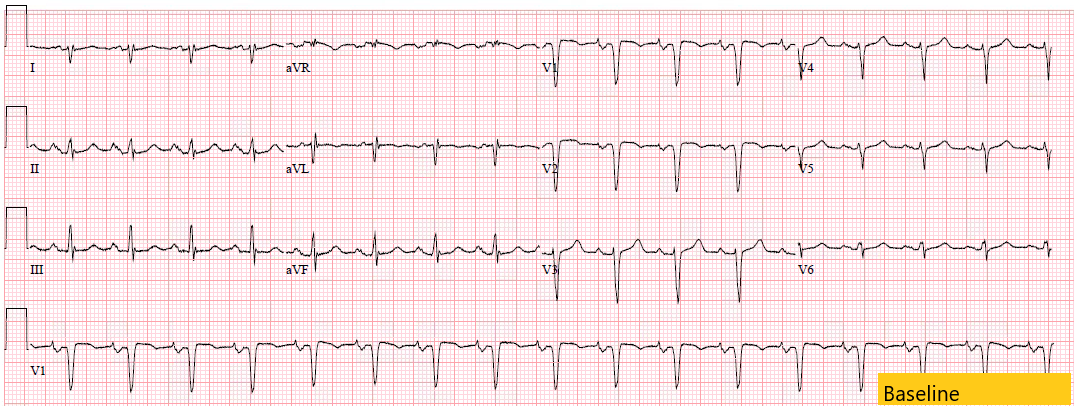
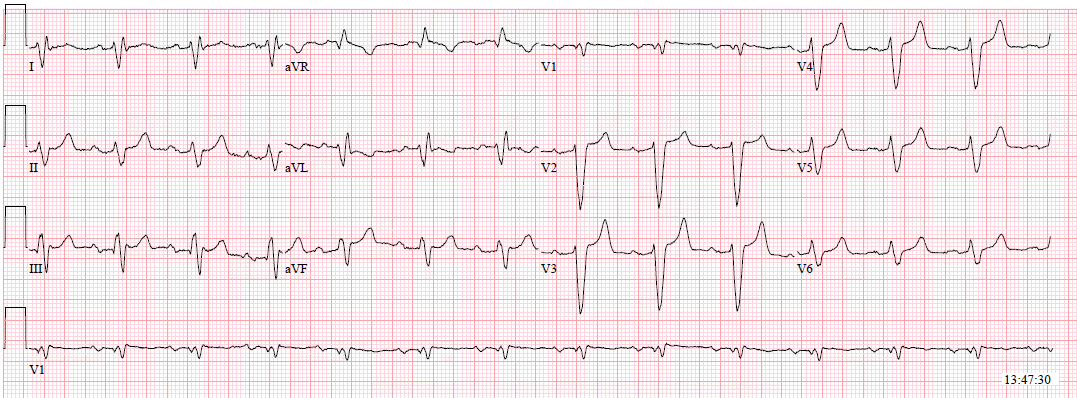
A 56-year-old woman presents to the emergency department. Her history is significant for type 2 diabetes, ischemic cardiomyopathy, CAD with CABG, and recent elective LAD stent complicated by ischemic colitis requiring hemicolectomy and colostomy. She is complaining of several days of intermittent dizziness, bilateral weakness, and several episodes of left-sided chest and upper abdominal pain described as a “stabbing” sensation. She also complains of suicidal ideations in the setting of multiple psychosocial stressors and ongoing medical issues. Her vital signs are within normal limits. Her ECG on presentation is shown above, as well as her most recent baseline ECG on file. Which of the following best describes the cardiac rhythm?
A. Junctional escape
B. Normal sinus rhythm
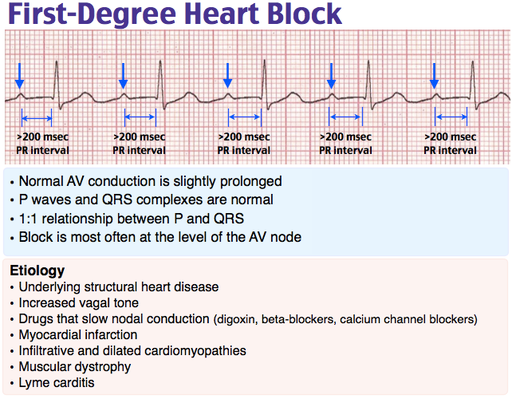
C. Normal sinus rhythm with first-degree heart block
D. Ventricular escape
Answer C
Normal sinus rhythm is sinus rhythm of 60 to 100 bpm. This is a normal sinus rhythm with 1:1 relationship between P waves and QRS complexes and normal rate (60–100 bpm). First-degree heart block is present when there is ≥ 200 msec from the onset of the P wave to the onset of the QRS complex. In this case, the PR interval is greater than one large box (200 msec) making the best description normal sinus rhythm with a first-degree heart block.
Junctional escape (A) occurs when the pacemaker above the junction is absent or slow enough that the intrinsic junctional pacemaker rate is faster and produces a narrow (in the absence of preexisting abnormal QRS) regular QRS rhythm. Normal sinus rhythm (B) is sinus rhythm of 60 to 100 bpm. Ventricular escape (D) is the equivalent process in the ventricular myocardium outside the conduction system and thus results in a wide QRS complex because it usually does not access the specialized conduction system. This rhythm has clear P waves with 1:1 relationship to the QRS and is not an escape rhythm.

Which of the following best describes the QRS morphology?
A. Left bundle branch block
B. Nonspecific intraventricular conduction delay
C. Ventricular paced rhythm
D. Ventricular rhythm (e.g., AIVR, VT)
Answer B
Nonspecific intraventricular conduction delay (NSIVCD) describes a wide QRS pattern (> 120 msec) that does not meet the criteria for any specific bundle branch block or fascicular block. There are many possible causes, including permanent structural disease of the myocardium (e.g., cardiomyopathy) and transient conditions that slow action potential propagation (e.g., hyperkalemia, sodium channel blockade). This case fits this description, as it does not meet the morphology criteria for LBBB in all leads despite having appropriate morphology in leads V2–V4.
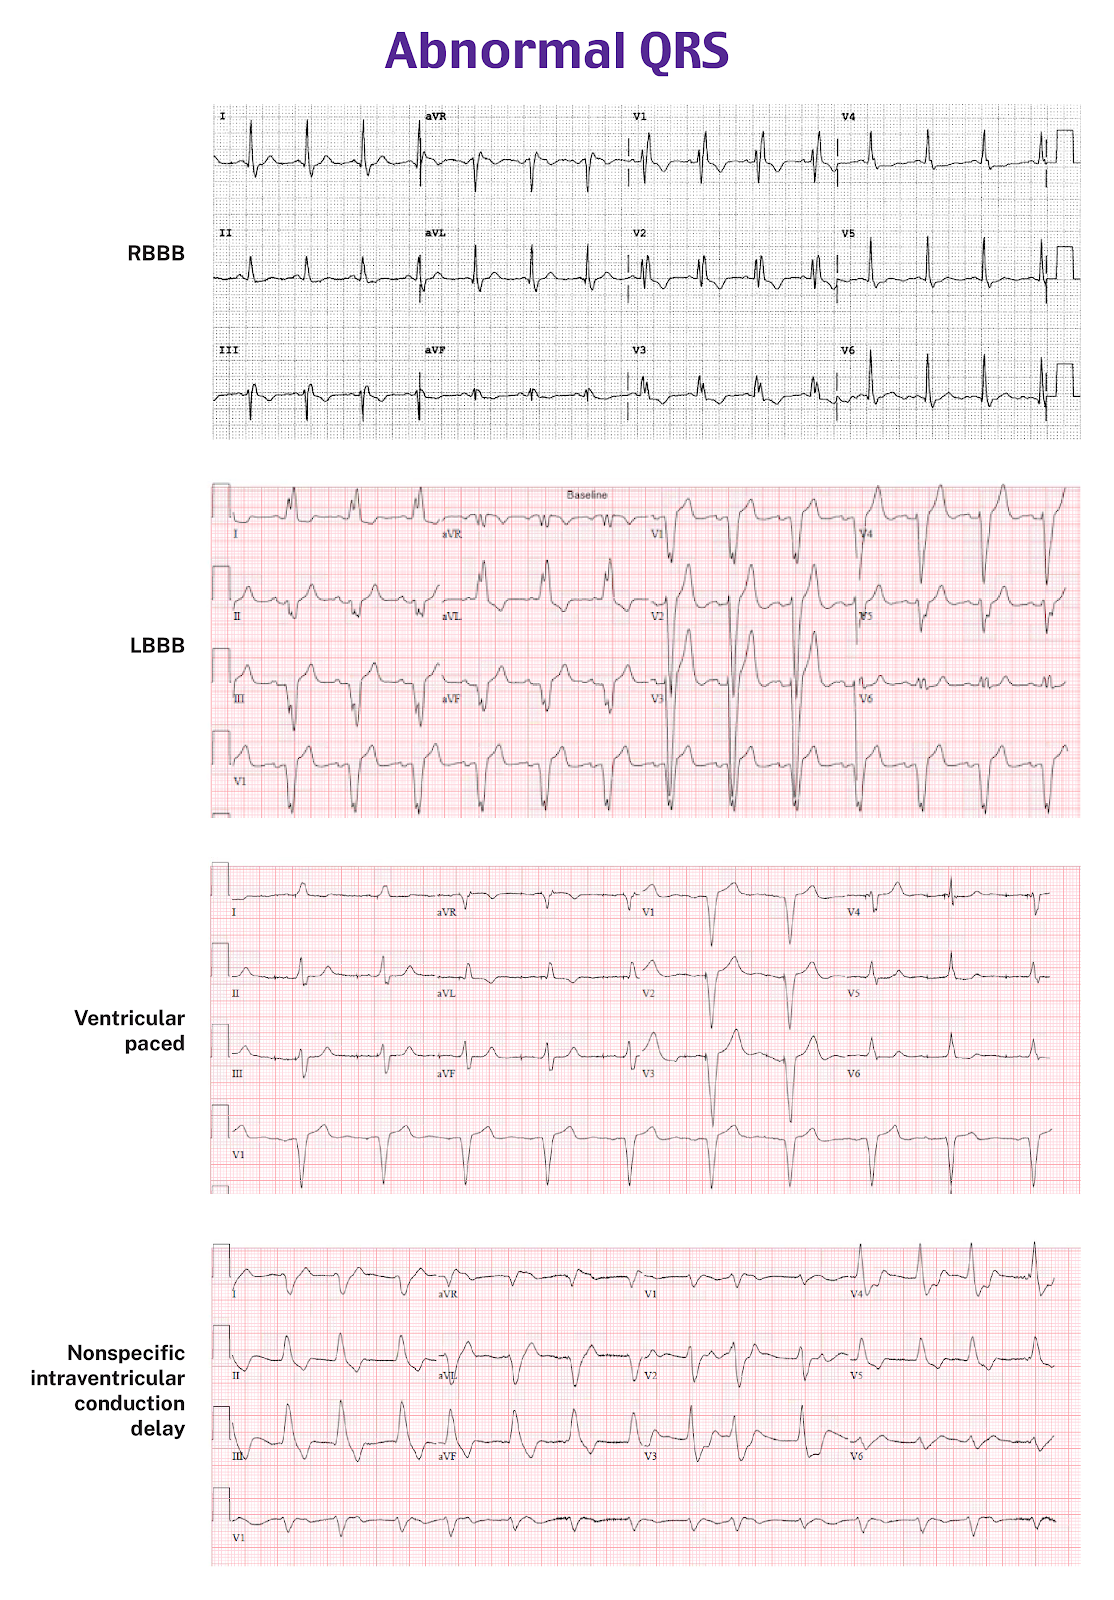
Left bundle branch block (A) is characterized by QRS duration ≥ 120 msec, predominantly negative (QS or rS) QRS complexes in the right precordial leads (V1–V2), and monophasic R waves in the leftward leads (V5–6, I, and aVL). In this case, leads I and aVL are predominantly negative or isoelectric, which is not mechanistically compatible with LBBB.
Ventricular paced rhythm (C) is characterized by a pacer spike followed immediately by a wide QRS complex with morphology determined by the location of the pacing lead.
Monomorphic ventricular tachycardia (D) is characterized by a regular, wide QRS complex (which can have many different morphologies depending on the site of origin in the ventricle) and may show certain features, including AV dissociation, capture beats, fusion beats, precordial QRS concordance, extreme axis deviation, and other characteristic findings.
Which of the following choices is the best interpretation of this ECG?
A. No evidence of ischemia on ECG
B. Non-occlusion ischemia
C. Occlusion MI STEMI(+)
D. Occlusion MI STEMI(−)
E. Reperfusion from occlusion MI
Answer A
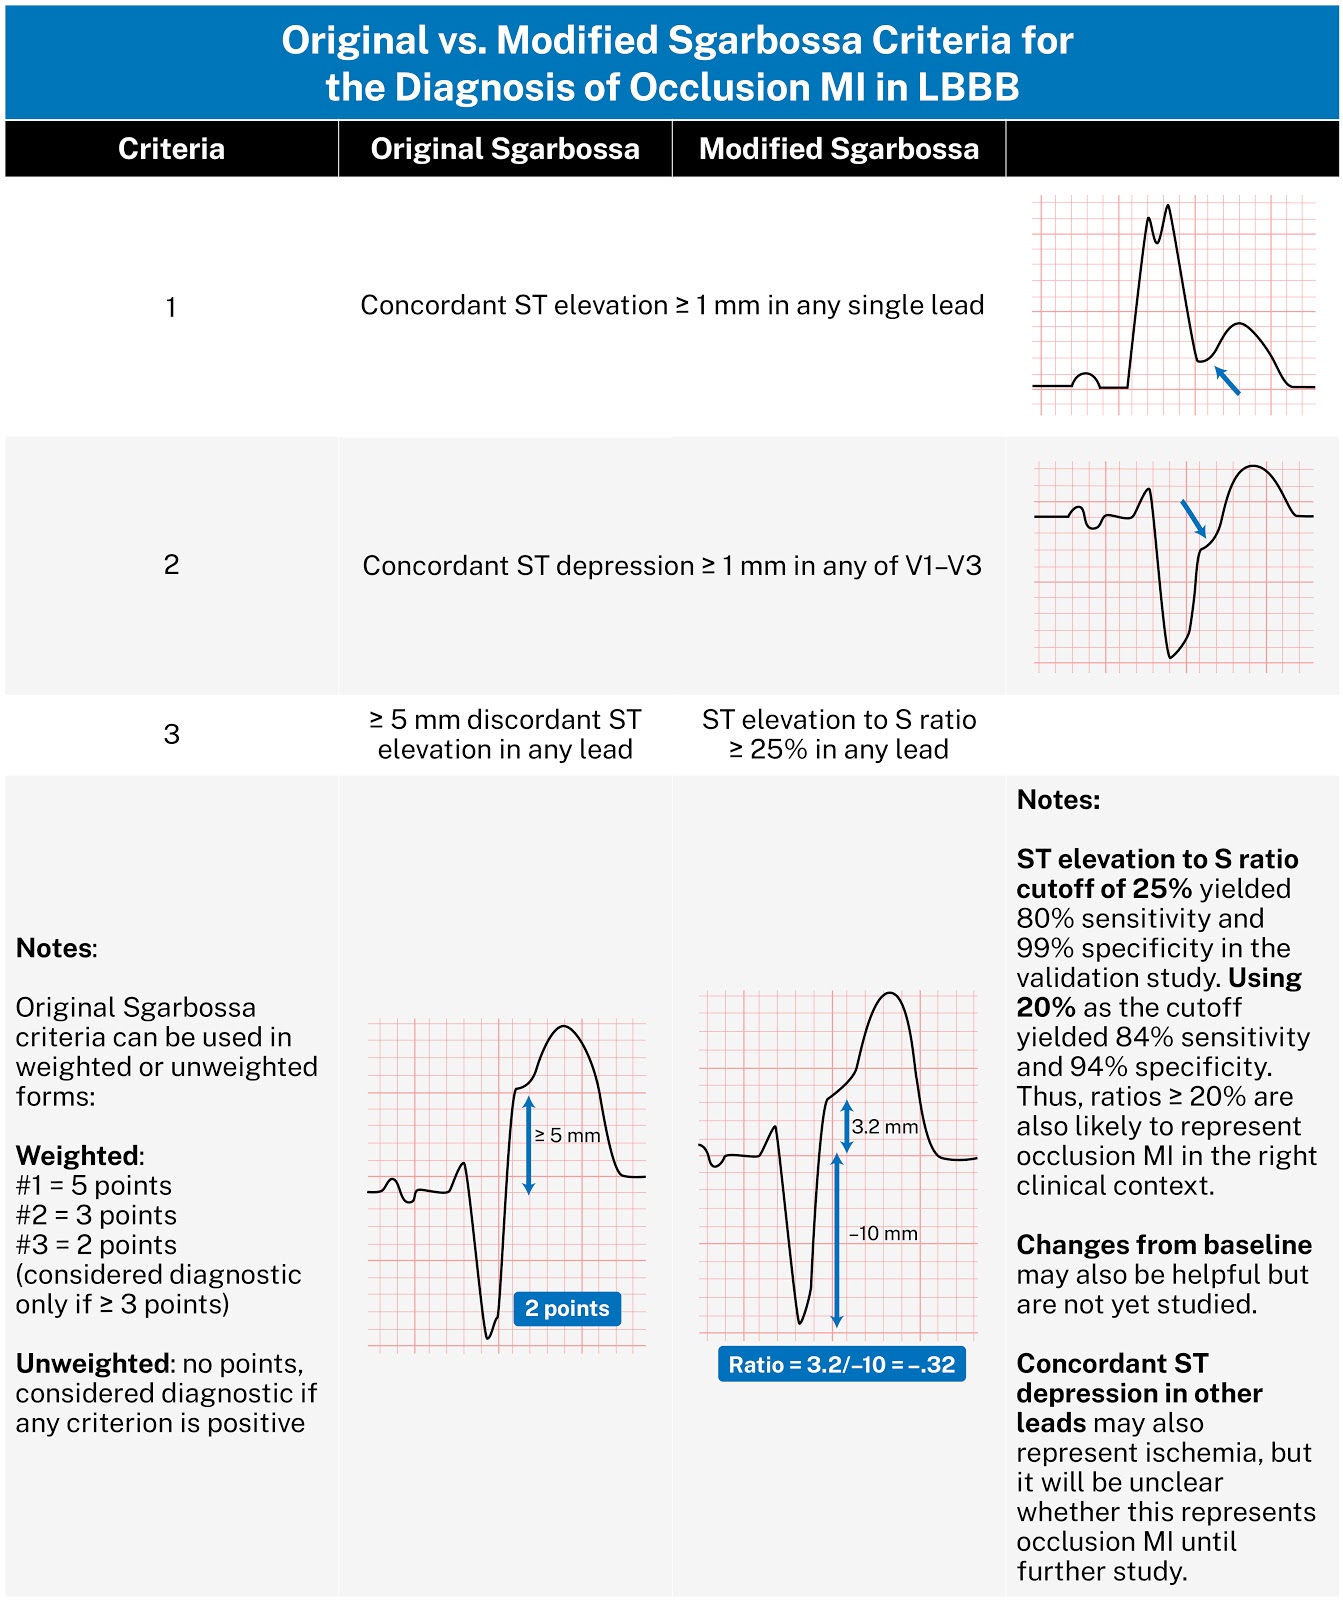
This ECG shows ST elevation in multiple leads, which is appropriately discordant to abnormal QRS complex (in this case, NSIVCD). The principle of QRS context states all ST segments and T waves can only be interpreted in the context of their preceding QRS context, and the principle of appropriate discordance states the ST segment and T wave may be displaced discordant (in the opposite direction) from the most abnormal component of the abnormal QRS complex. The expected magnitude of discordance is proportional to the degree of QRS conduction abnormality (as would be expected by the principle of proportionality) and has only been quantified thus far in LBBB (most patients have up to 15% discordance on baseline ECG). In this case of significant NSIVCD, a similar ratio would be expected. For example, in V3, the ratio of ST elevation to S wave is approximately 1.5 mm to 13.5 mm = 11.1%. In addition, the cause of this patient’s NSIVCD also affects the interpretation of this ST elevation. Although this ECG does have ST elevation, this ST elevation is likely appropriate for the abnormal QRS complex and is not likely to be ischemic ST elevation.
Non-occlusion ischemia (B), or diffuse supply-demand mismatch ischemia, is characterized by diffuse ST depression maximal in V4–V6 and lead II, with reciprocal ST elevation in aVR.
This ECG is not by itself suspicious for occlusion MI (D), regardless of whether the ST elevation meets formal STEMI criteria (C). In this case, the raw ST elevations likely meet STEMI criteria, but those criteria are not applicable in such abnormal QRS complexes.
Reperfusion of occlusion MI (E) is characterized by resolution of occlusion MI findings with T wave inversion in the affected leads, starting with terminal T wave inversion and progressing to full T wave inversion.
Which of the following best describes the interpretation of this ECG for hyperkalemia?
A. No signs of hyperkalemia
B. Signs of mild to moderate hyperkalemia present
C. Signs of severe hyperkalemia present
Answer C
Comparison of the presentation ECG with the prior ECG shows the only difference between the QRS complexes of the two ECGs is the width. This suggests the action potential followed exactly the same pathway down the conduction system but at a slower conduction speed than in the prior ECG. Therefore, this patient has a derangement of action potential propagation that is slowing the speed of conduction and widening the QRS complex. Of the conditions that cause slowing of action potential speed and wide QRS complexes, there is one condition that is more common, more dangerous, more recognizable, more rapidly life-threatening, and more readily treatable than all the others: hyperkalemia. The T waves in this case are also peaked in comparison to the prior ECG, and there is new PR prolongation. Severe hyperkalemia is characterized by the killer Bs of hyperkalemia, including broad (QRS widening), brady (bradycardias, escape rhythms), blocks (heart blocks), and bizarre (unusual morphologies, sine wave, bizarre STEMI mimics).
This ECG shows signs of severe hyperkalemia, thus no signs of hyperkalemia (A) is incorrect.
Mild to moderate hyperkalemia findings (B) may include peaked T waves, PR prolongation, and P wave flattening but generally should not affect the QRS complex or the cardiac rhythm itself.
Which of the following is the best interpretation of the QT interval?
A. Normal QTc
B. Prolonged QTc
C. QTc interval is controversial or not easily assessable in this case, but there is no extreme QT abnormality present
D. Short QTc
Answer C
All wide QRS complex morphologies signify delayed sequence of depolarization, and thus there must also be delayed sequence of repolarization. There is no current consensus on the approach to measuring the corrected QT interval in patients with significantly abnormal or wide QRS complexes (e.g., LBBB, ventricular paced rhythm, NSIVCD), with many proposed rules of thumb as well as derived formulas. Proposed methods include subtracting the QRS prolongation from the QT measurement, using the JT interval instead of the QT, using the T-peak to T-end interval, and various formulas derived by logistic regression. Currently, there are no consensus definitions, and clinical practice varies widely in these cases, with management decisions usually based on a combination of clinical gestalt, subjective ECG interpretation, and telemetry. In this case, the rule of thumb using visual inspection clearly shows the QT interval is less than half the R-R interval, and thus there would be no concern at this time of prolonged QT interval even though there is no formal definition in this QRS context.
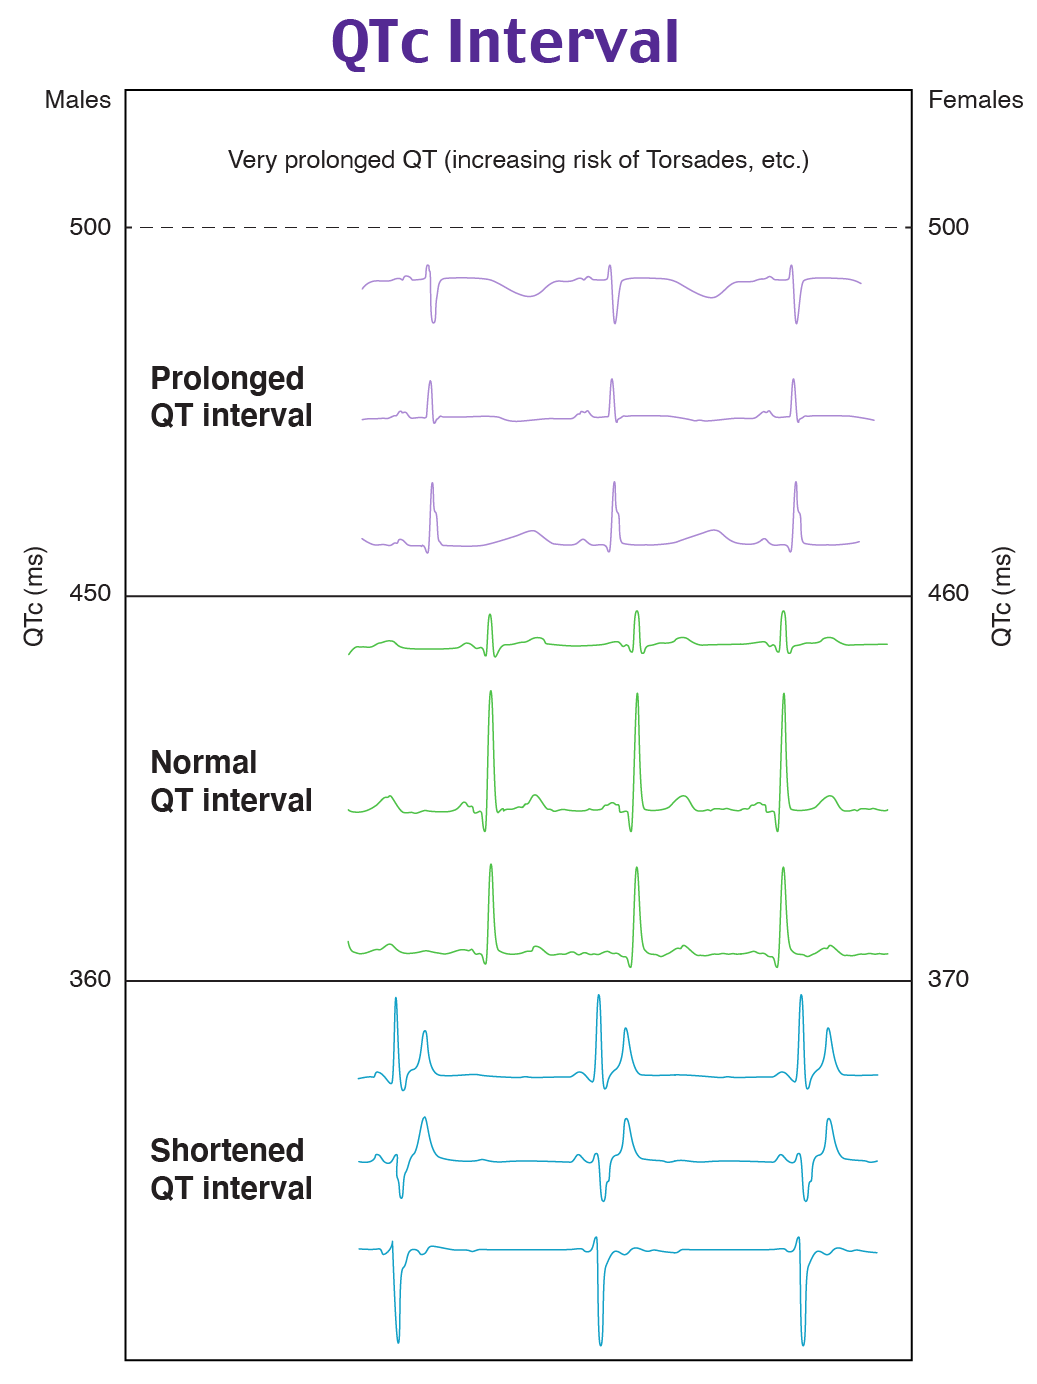
Normal QTc (A) interval (in the absence of complicating factors such as abnormal QRS complex morphology) is usually defined as < 460 msec for women and < 450 msec for men and can be visually estimated by ensuring the QT interval is not longer than half the R-R interval. (This rule of thumb works best at ≥ 60 bpm.) The raw QT interval should be adjusted for heart rate but also can be adjusted for sex, age, QRS duration, and the presence of atrial fibrillation or other dysrhythmias.
Prolonged QTc (B) interval (in the absence of complicating factors such as abnormal QRS complex morphology) is usually defined as > 460 msec for women and > 450 msec for men and can be visually estimated by the QT interval being half or more of the preceding R-R interval.
Shortened QTc (D) is relatively rare and variably defined. Some sources, such as the AHA, consider short QTc < 390 msec, while other authors describe it as < 360 msec for men and < 370 msec for women. We will use < 360 msec for men and < 370 msec for women as significantly short QTc.
Case Resolution:
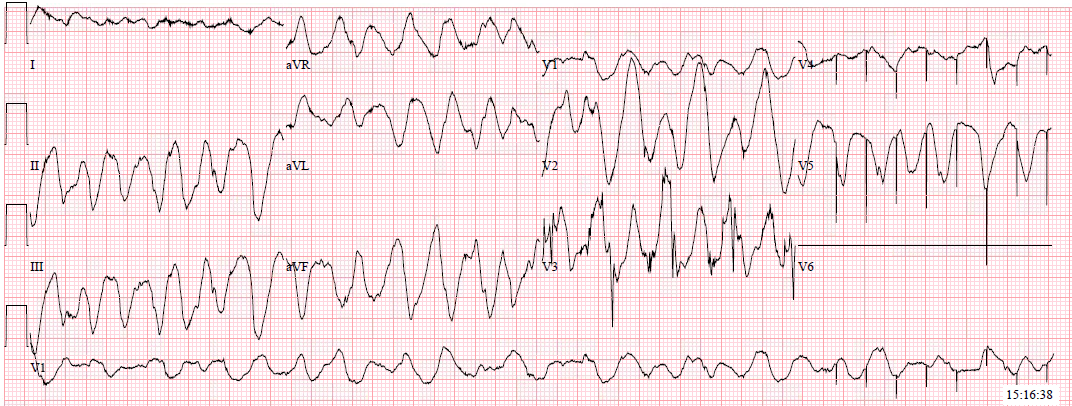
The possibility of hyperkalemia was not noticed initially by the clinicians. Initial labs were drawn and sent, and the clinicians had planned for a broad evaluation, including chest pain and abdominal pain workups, given her recent colostomy and abdominal pain. Approximately 45 minutes after arrival, before any labs had returned, she was suddenly noted to have intermittent periods of obtundation alternating with respiratory distress and worsening pain. Before being rushed to the resuscitation bay, a repeat ECG was performed:
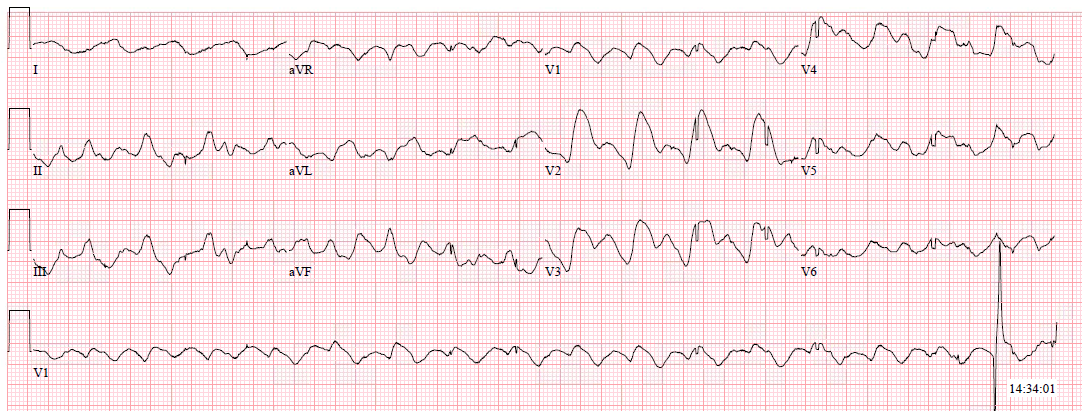
Interpretation:
This shows an extremely wide QRS, which is difficult to delineate from the ST segment and T wave. This is approaching a sine-wave pattern and indicates end-stage hyperkalemia, which usually precedes an unstable tachy- or bradydysrhythmic cardiac arrest.
Hyperkalemia was not suspected immediately after this ECG. Given the patient had chest pain on arrival and hyperkalemia had not been suspected on the initial ECG, in a patient with acute worsening, a STEMI alert was called based on perceived ST elevations in the anterior leads V2–V4.
On the way to the resuscitation bay, the patient became unconscious and lost pulses. CPR was initiated. The monitor showed VF, and she was shocked twice without conversion. On review of the initial ECGs, hyperkalemia was suspected at this point, and the patient received IV calcium and bicarbonate, with ROSC achieved 1–2 minutes later.
Initial labs (~1 hour prior to arrest) finally returned, showing the following:
Potassium: 8.1 mEq/L
Blood urea nitrogen: 99 mg/dL
Creatinine: 6.84 mg/dL
Troponin: < 0.01 ng/mL
In the first few minutes after ROSC, the patient had multiple changes in the cardiac monitor with several ECGs recorded:
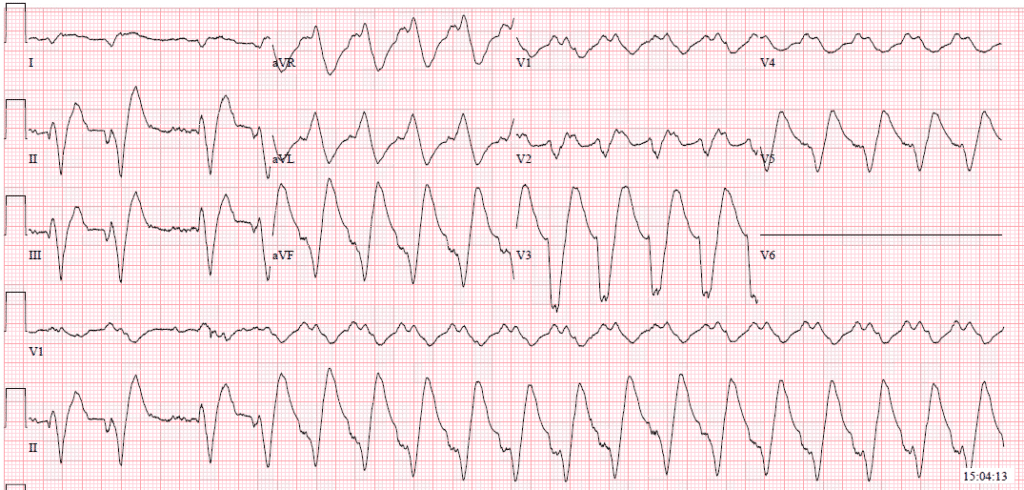
Defibrillation was attempted several times, each with temporary improvement to a more organized wide complex tachycardia, then returning to VT or VF.
Several more doses of calcium chloride and bicarbonate were administered. Within minutes, the patient achieved sustained ROSC, and another ECG was recorded:
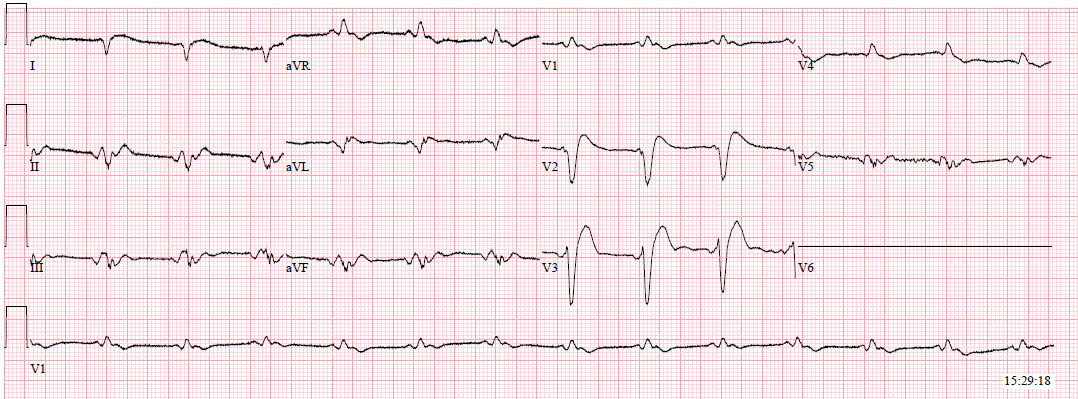
This sinus rhythm has a much narrower (but still wide) QRS complex. There is perhaps a short QT and QTc interval here, which may be caused by the calcium.
A dialysis catheter was placed, and the patient was started on continuous hemodialysis. No further arrests or deterioration in rhythm occurred. The patient recovered and did not require long-term dialysis.
References:
Smith SW, Zvosec DL, Sharkey SW, Henry TD, eds. The ECG in Acute MI: An Evidence-Based Manual of Reperfusion Therapy. Lippincott Williams & Wilkins; 2002.
Chan TC, Brady WJ, Harrigan RA, Ornato JP, Rosen P, eds. ECG in Emergency Medicine and Acute Care. Elsevier; 2005.
Is there a beginner’s ECG Qbank?
If you’re interested in a beginner-level ECG Qbank that teaches the basics about ECGs (good for anyone who is in the beginner or intermediate stages of ECG learning, such as medical students or residents, PA students, and those working in fields that are less focused on ruling out acute life-threatening ECG findings in patients with acute complaints), it’s in the works!
If you work in acute care medicine and are ready to hone your ECG-interpreting skills, try the Clinical ECG Qbank today.
Access the Clinical ECG Qbank

You must be logged in to post a comment.
Comments (0)